

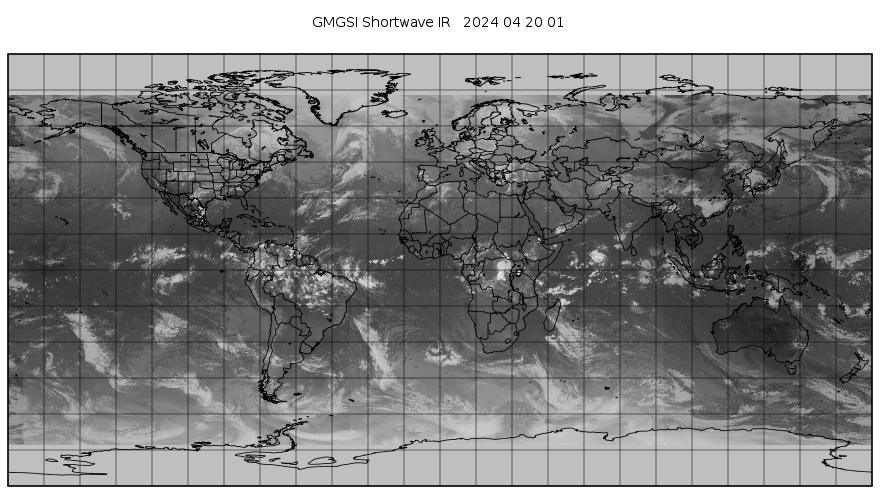


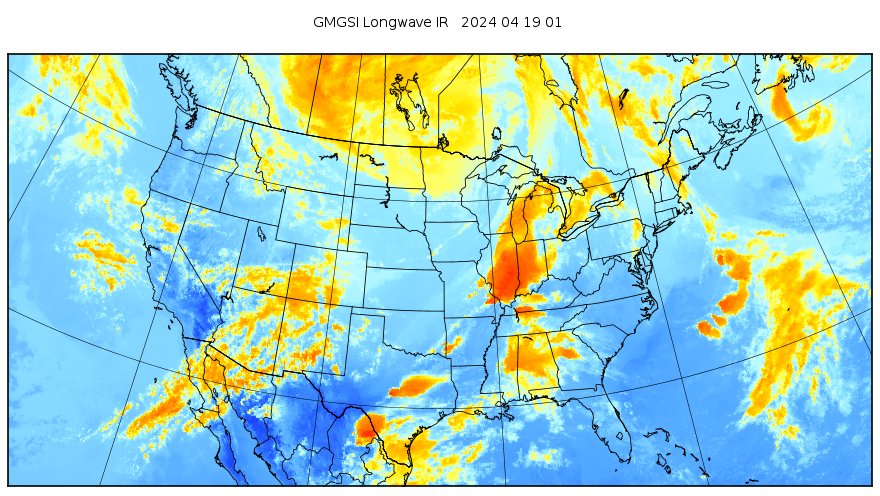


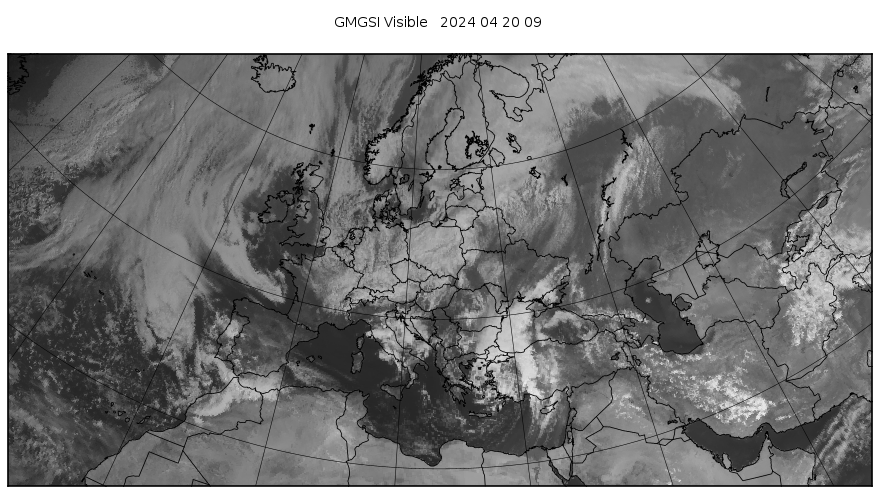


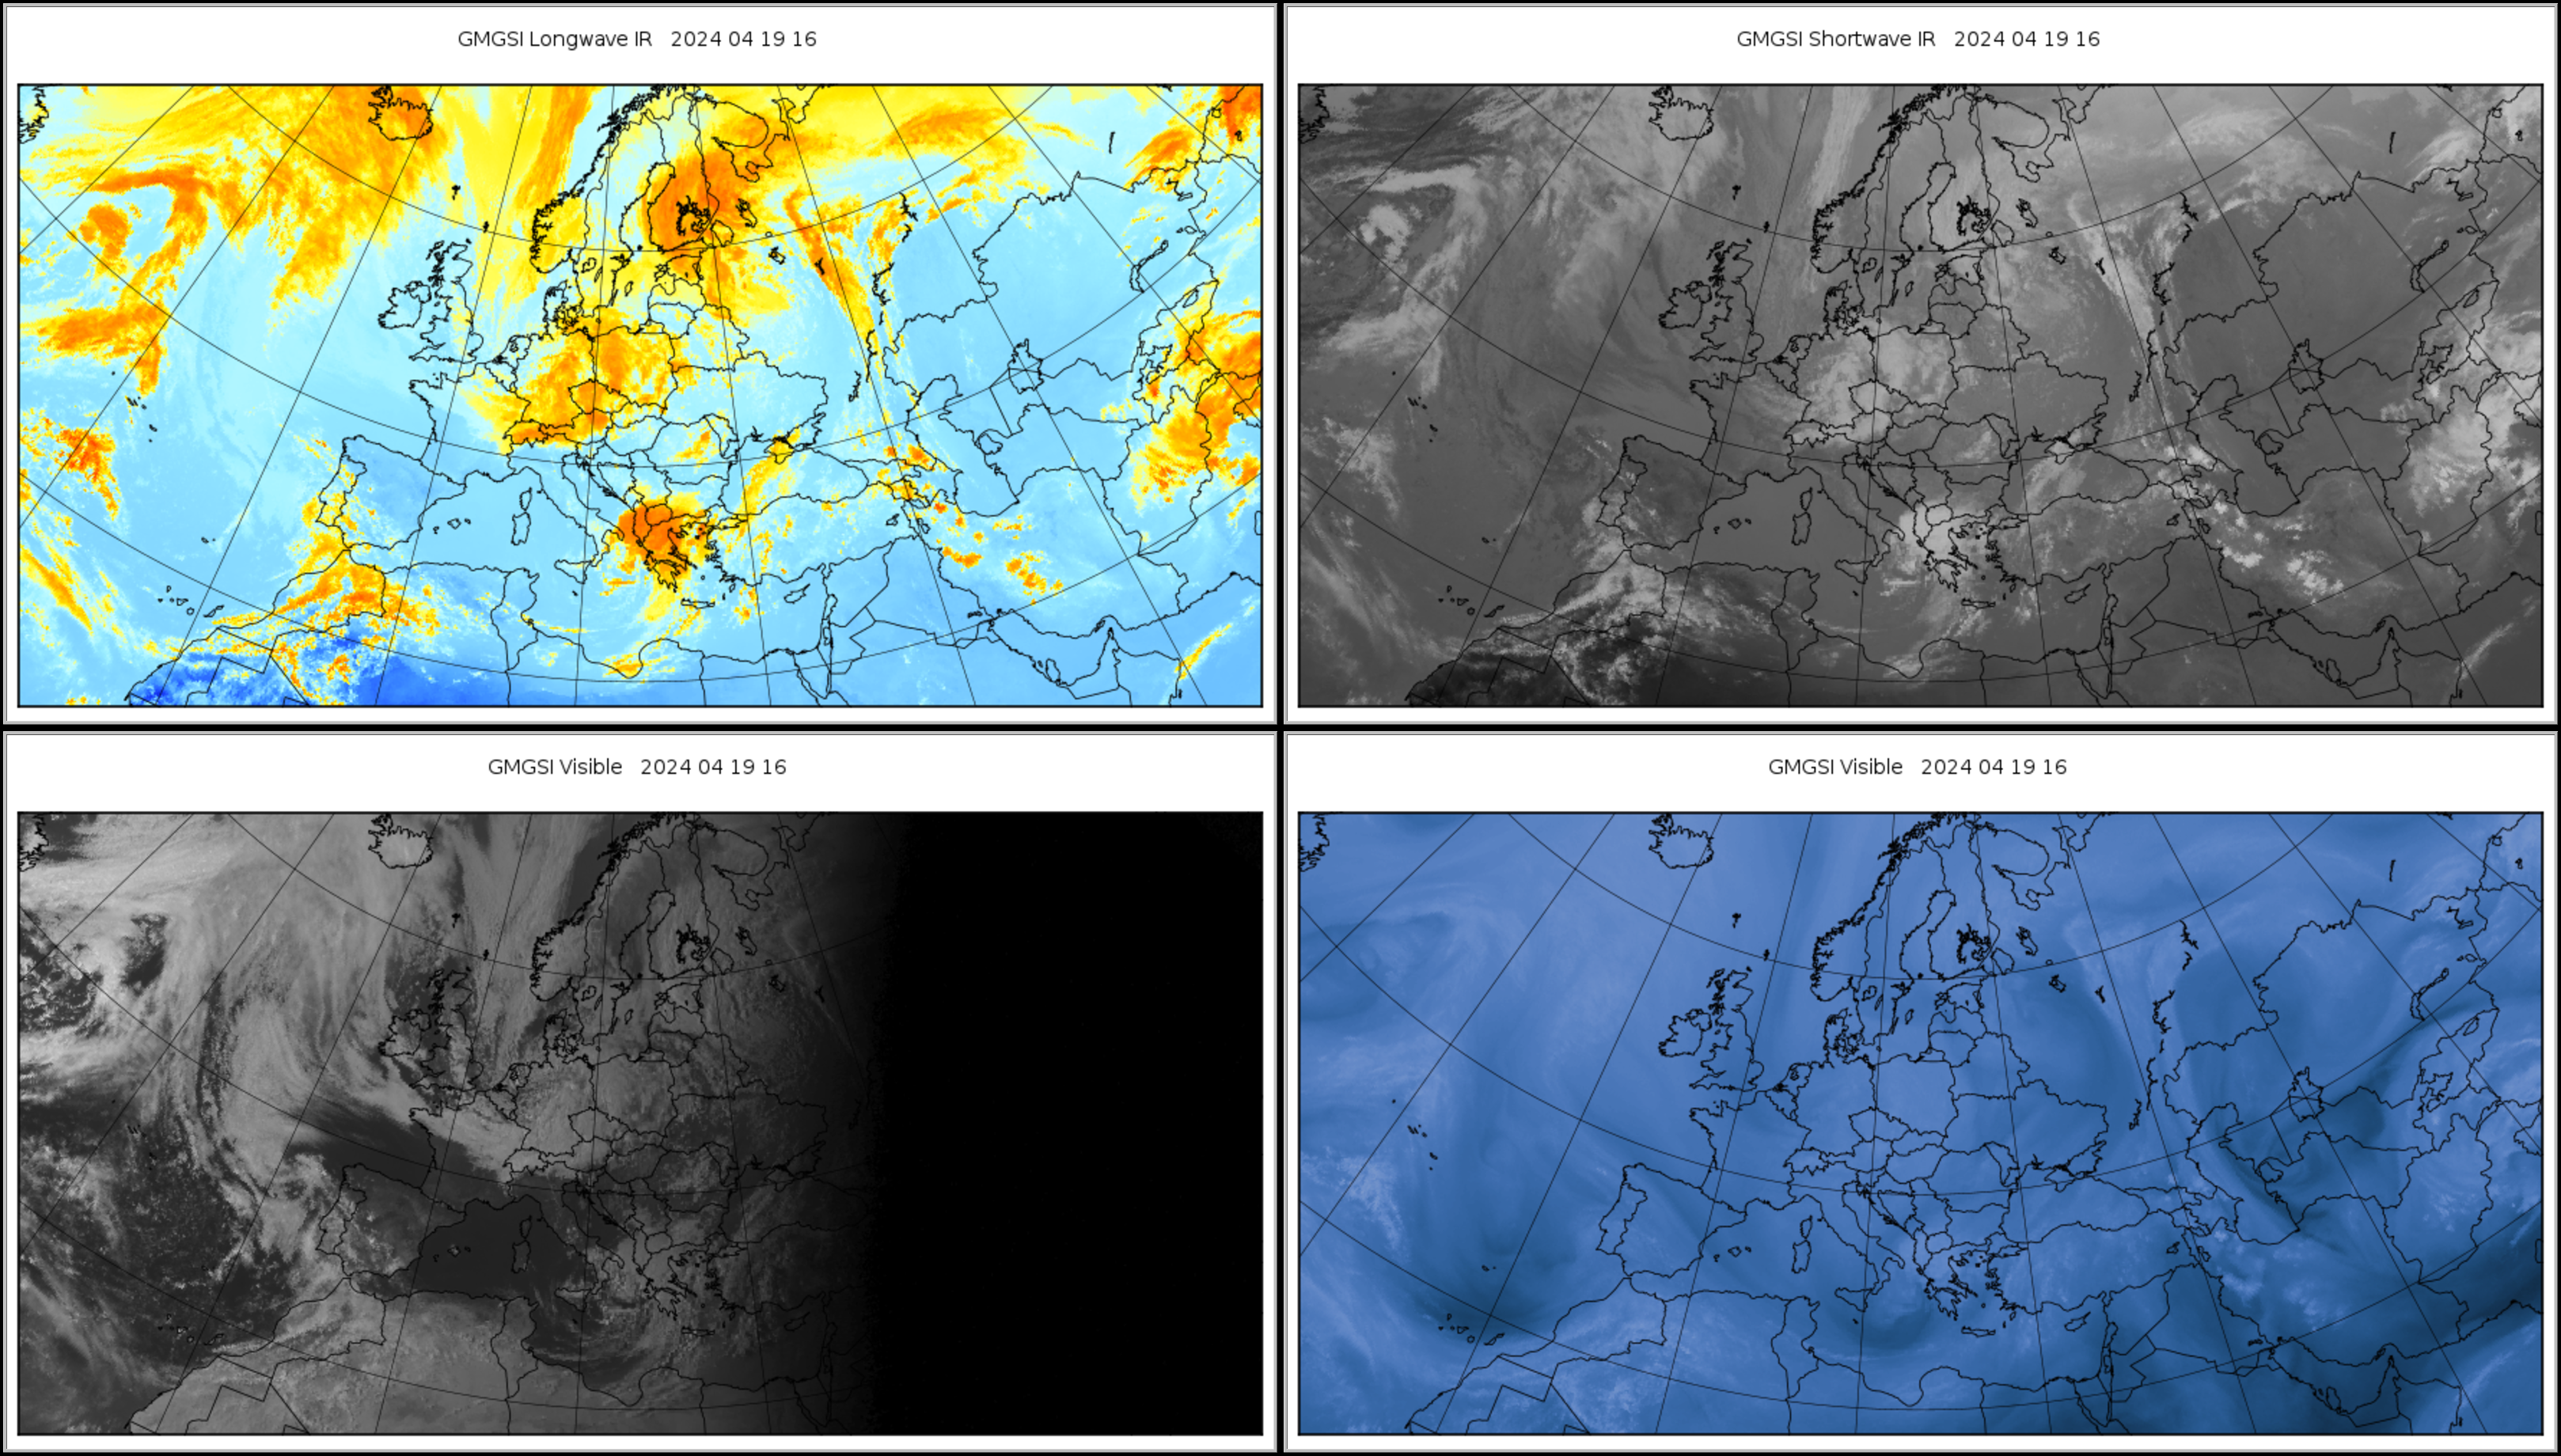


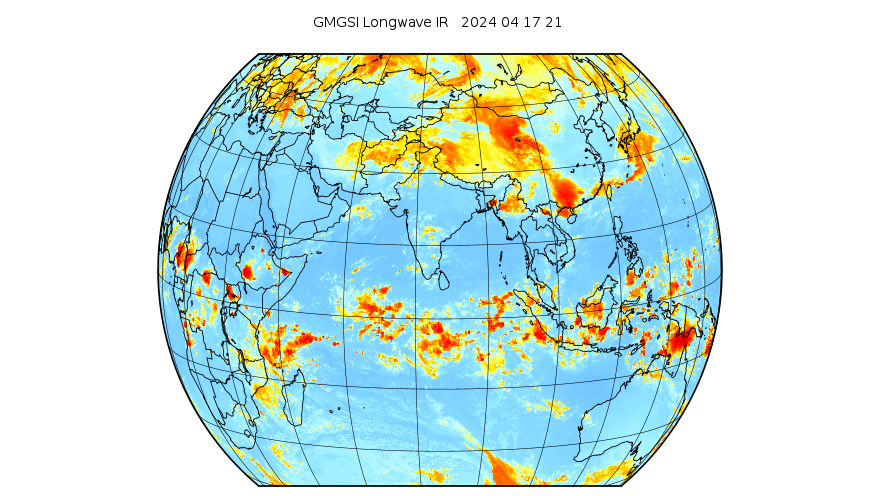


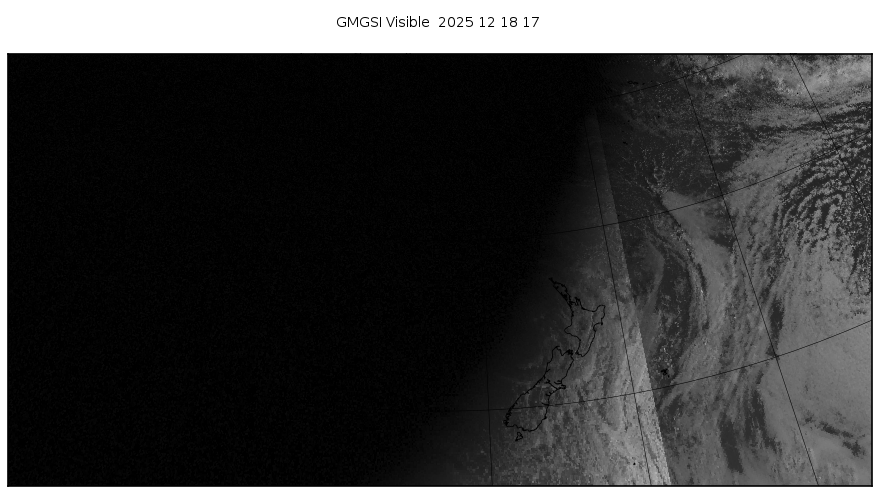
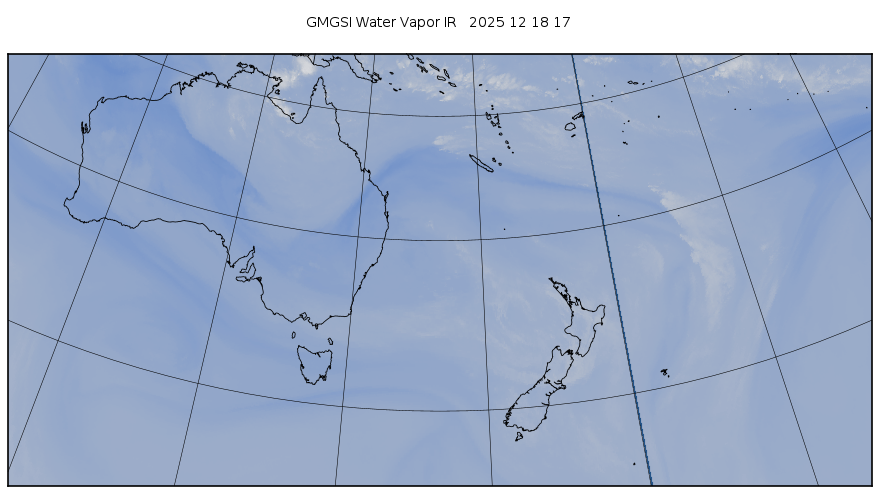
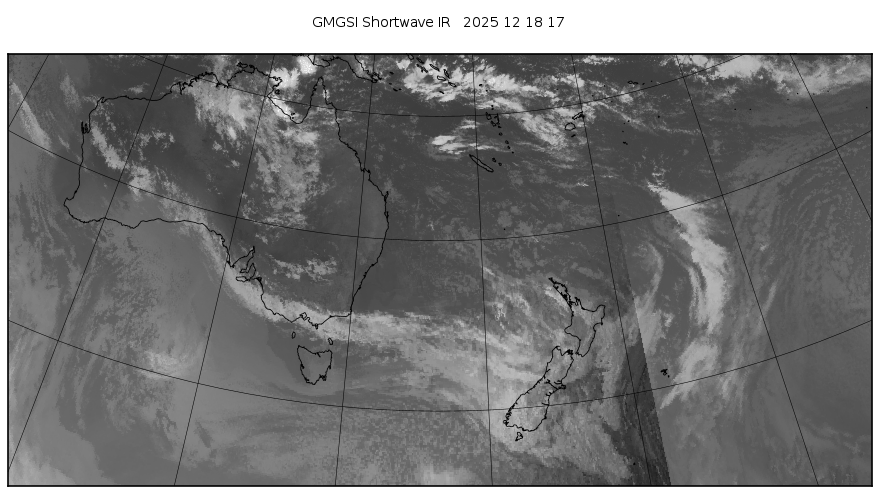
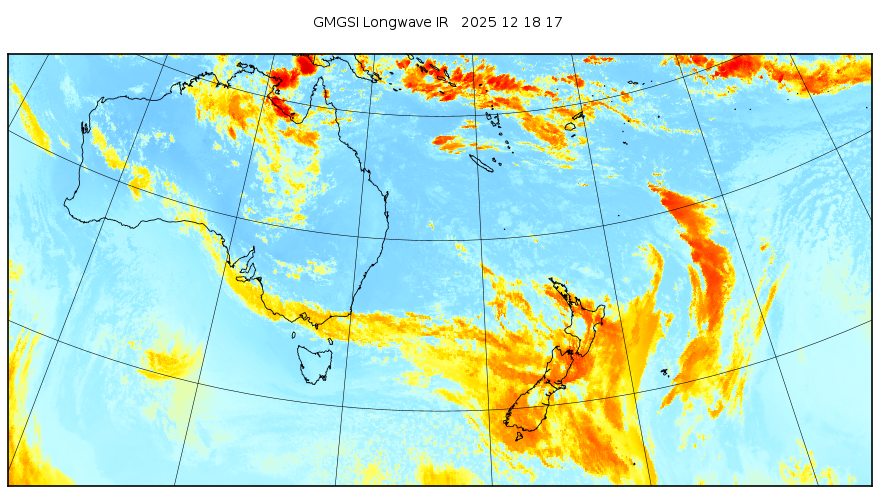
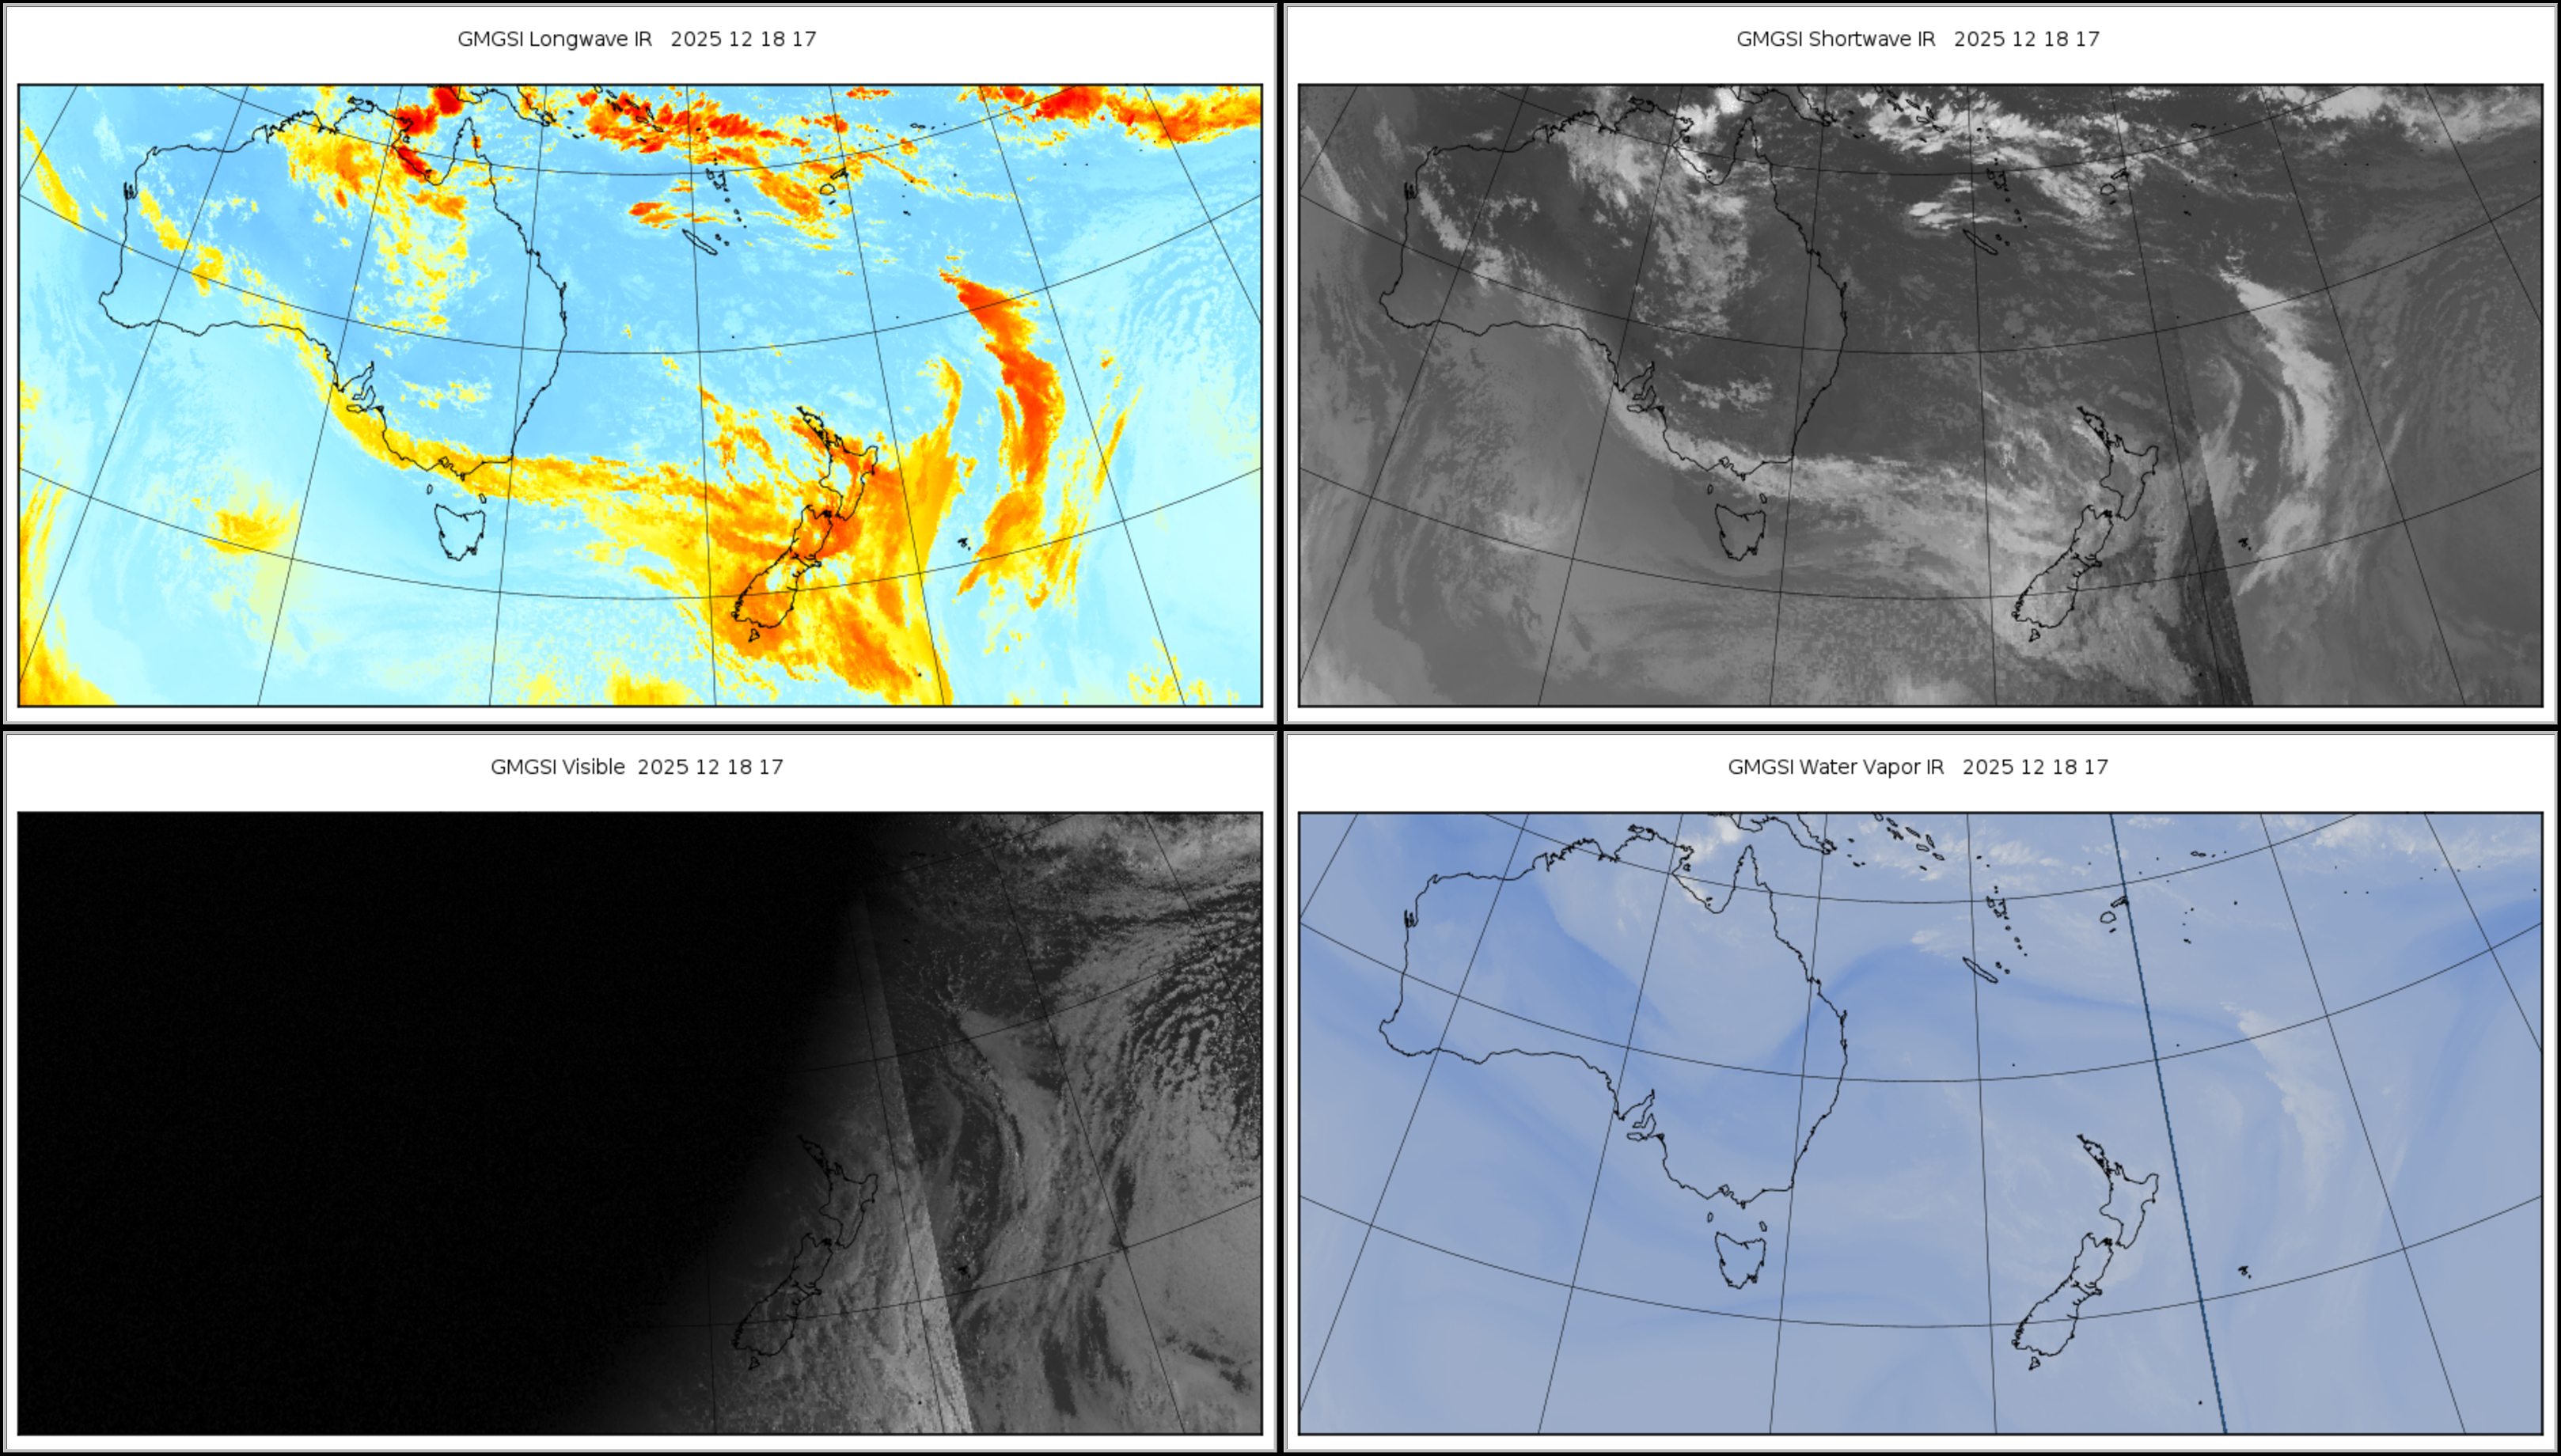
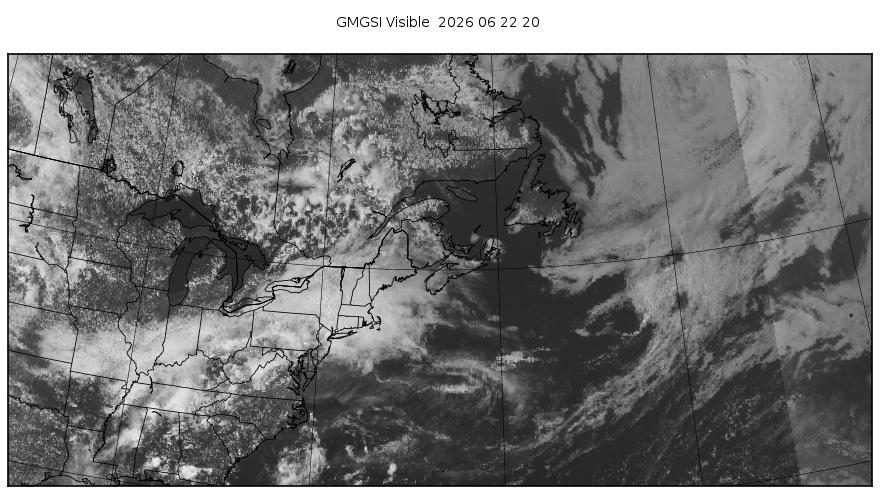
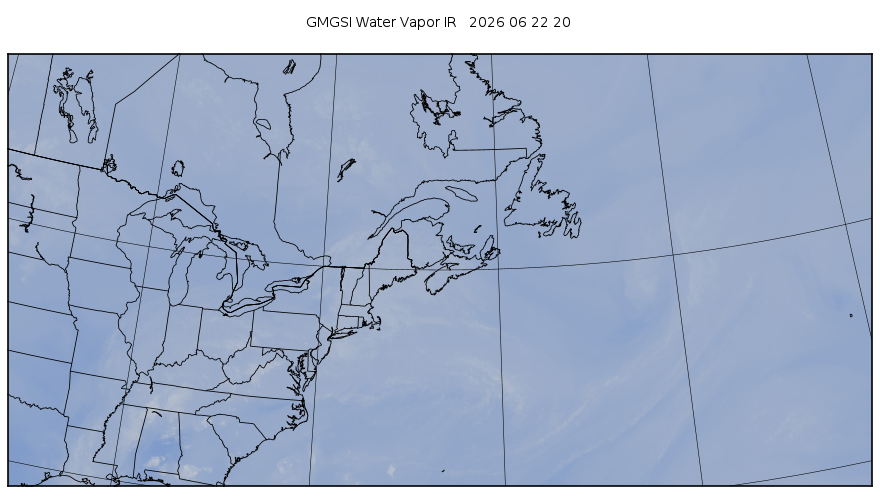
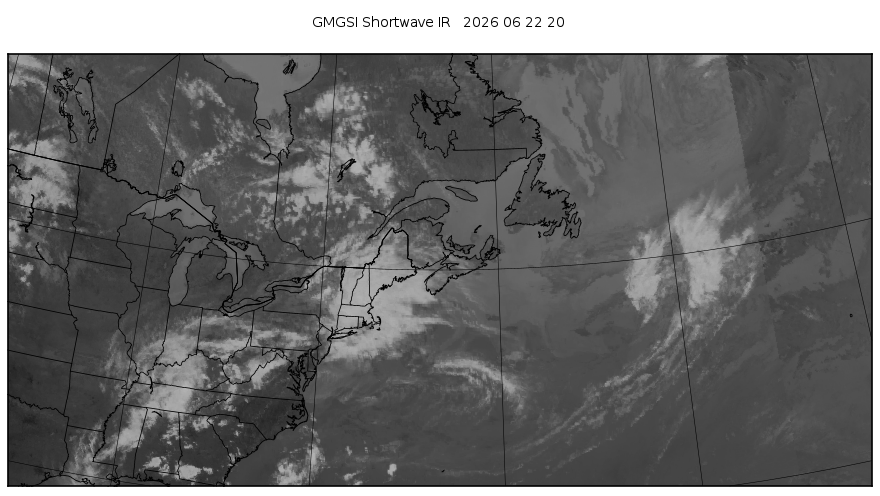
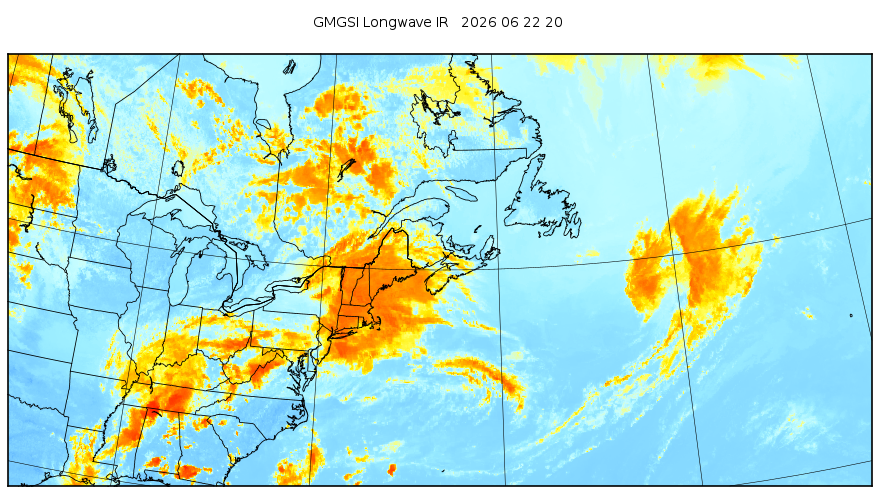
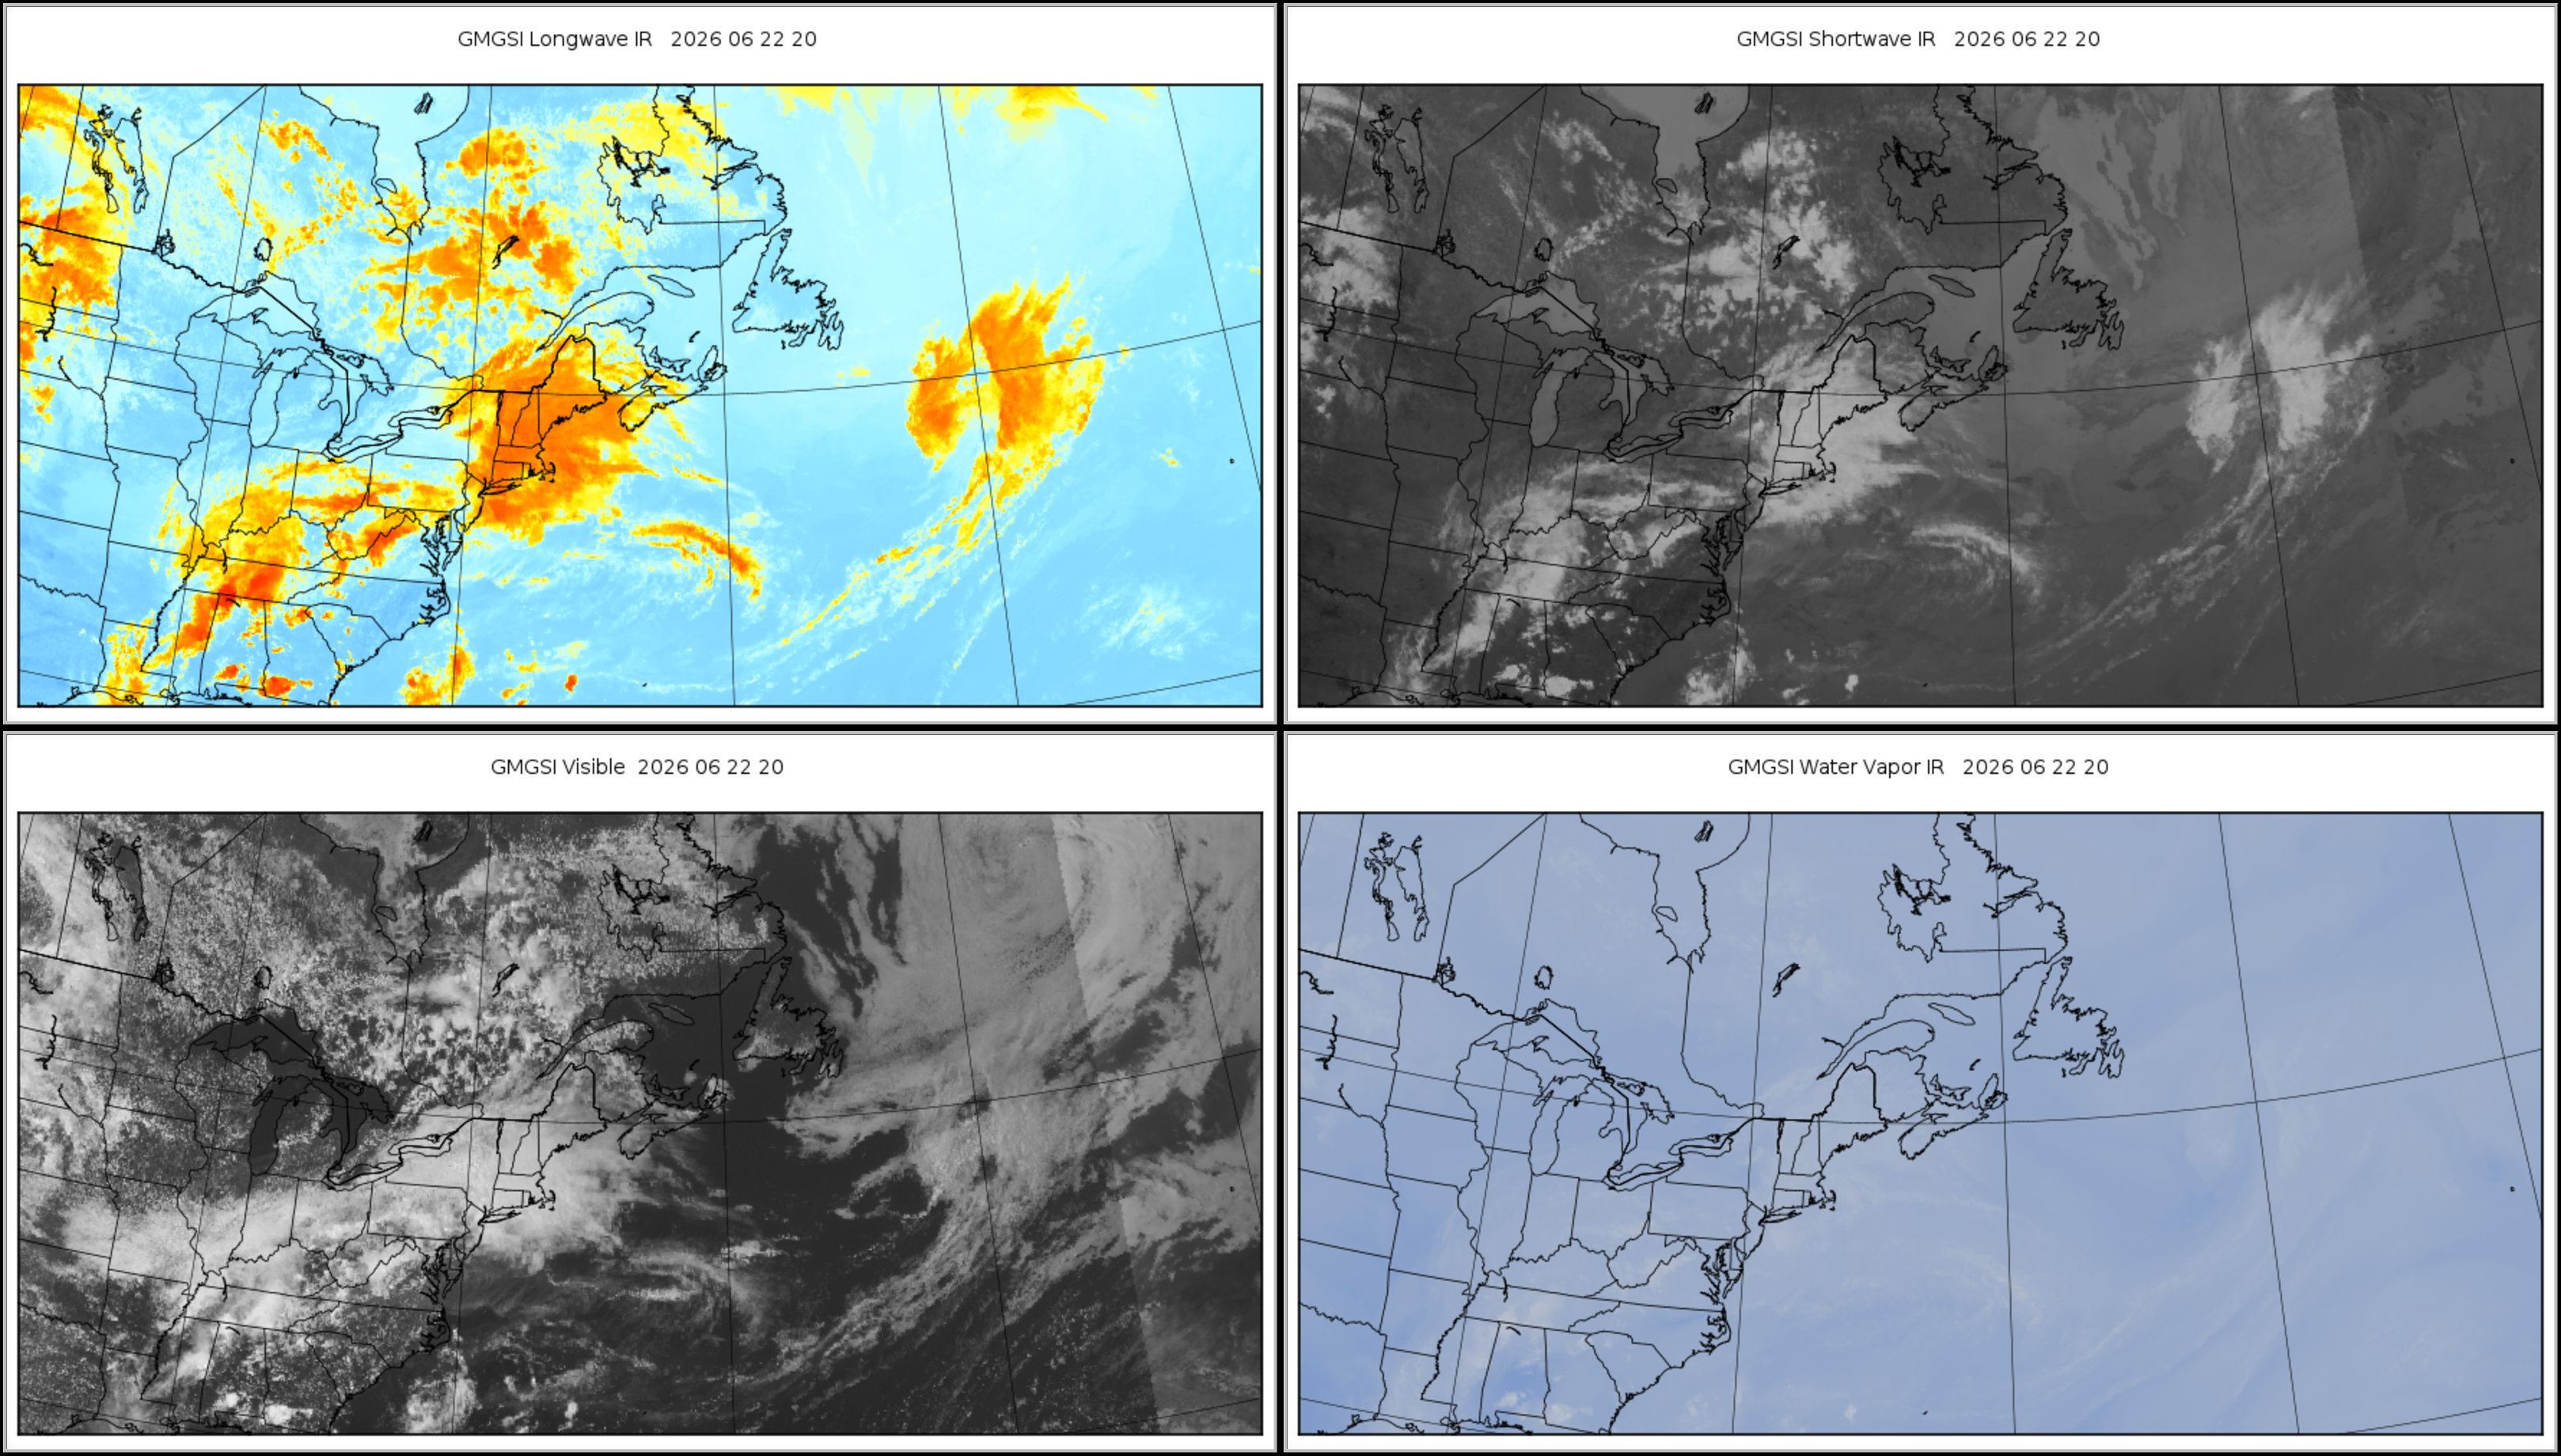
Multiple weather satellites watch over the clouds and other features in the atmosphere on a continuous basis. These satellites are launched and operated by several different nations and it can be challenging to find a satellite image for many areas of the world. NOAA has started to produce a product that is a composite of five geostationary satellites around the world. This product is called the NOAA Global Mosaic of Geostationary Sattellite Imagery (GMGSI). The images are produced for four radiation bands: visible (0.6 microns), long-wave infrared (about 12 microns), short-wave infrared (about 3.8 microns), and an infrared channel that can show the middle-atmosphere water vapor patterns (6.7 microns).
Much more information can be found on the GMGSI home page, and the GMGSI AWS (Amazon Web Services) NOAA Big Data page.
The GMGSI data is downloaded shortly after it is available from the GMGSI AWS archive referenced above. New images
are usually available about :10 the following hour.
| Region | Visible | Water Vapor | Short IR | Long IR | Montage |
|---|---|---|---|---|---|
| World | | | | | |
| United States | | | | | |
| Florida | | | | | |
| Tropical Atlantic (MDR) | | | | | |
| Western North Pacific Ocean | | | | | |
| Europe | | | | | |
| Indian Ocean | | | | | |
| Central America | | | | | |
| Australia and New Zealand | | | | | |
| Canadian Maritimes | | | | | |
Animations from the previous 24-hours. These plots are updated at about :20 each hour.
| Region | Visible | Water Vapor | Short IR | Long IR |
|---|---|---|---|---|
| World |  |  | ||
| Tropical Atlantic (MDR) |  |  | ||
| United States |  |  |  |  |
| Canadian Maritimes |  |  |  | |